How to Build a Profitable Theme Park Business Model?
A Theme Park Business Model must turn memorable experiences into reliable income without making every visit feel like a sales pitch. Walt Disney, the pioneering creator of Disneyland, once said, “You can dream, create, design, and build the most wonderful place in the world. But it requires people to make the dream a reality.” That insight still matters. Guests may remember a smooth ride queue, a shaded path, or a cast member who helps a lost child. Those moments depend on staffing, maintenance, thoughtful design, and careful budgeting.
A profitable park usually combines admission with food, merchandise, events, and optional upgrades. The mix matters. A family waiting in the noon sun may not buy another souvenir, however attractive the shop looks. Attendance forecasts, average spending, labor costs, and seasonal demand should therefore be examined together. So should guest feedback. A packed park can still lose money if operating expenses rise faster than revenue. Not every idea works.
The sections ahead explore how to choose a target audience, shape a distinctive experience, and build revenue streams around it. They also examine pricing, capacity, staffing, marketing, and investment decisions. No model removes uncertainty. Rain, equipment downtime, or a weak off-season can expose assumptions that looked solid on paper. The goal is not a perfect spreadsheet. It is a resilient plan that protects the guest experience while giving the business room to grow.
Assess the Market and Define the Park’s Value Proposition
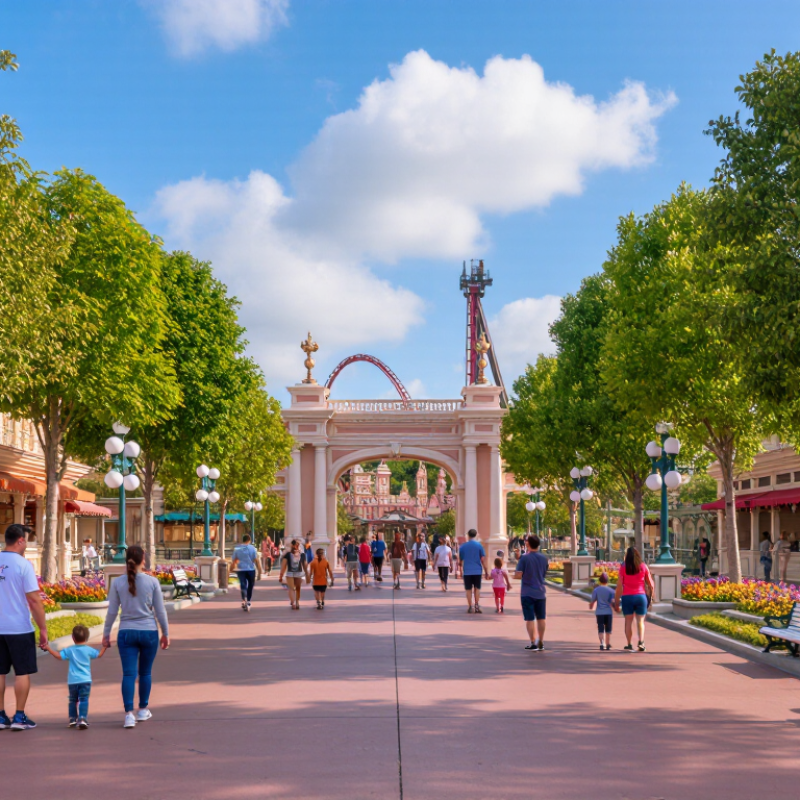
A profitable park begins with specific local demand, not a pile of rides. Map residents, tourist flows, school calendars, household budgets, and competing weekend activities within a realistic travel radius. Speak with families, teens, and tour operators; stated interest is not the same as a paid visit. Ask what they would replace, how far they would travel, and what price feels fair for a full day. Look for gaps. Nearby families may want shaded, hands-on attractions, while visitors may need a memorable half-day stop near transit. Treat both ideas as hypotheses, not facts.
Test them with small, measurable experiments: timed ticket offers, pop-up activity days, or interviews at local events. Track conversion, visit length, repeat intent, food spending, and complaints about queues or heat. Weather and seasonality can distort results, so compare weekdays and weekends across more than one month. Define the park’s value proposition clearly. State who it serves and what distinctive experience it delivers. Explain why the trip merits the time and ticket price. A forest setting matters only if trails, storytelling, and rest areas work together for guests. Be honest about weak points. An idea may sound compelling in a survey and still fail at checkout. Refine the offer before committing to expensive construction.
Assess the Market: International Tourist Arrivals
Global arrivals indicate the scale and recovery of travel demand that can support a theme park’s visitor market.
What this means: International arrivals recovered to approximately 1.4 billion in 2024, close to the 2019 level. Use this broad demand signal alongside local population, seasonality, visitor spending, and competing attractions when sizing a park and defining its value proposition.
Source: UN Tourism, World Tourism Barometer. Figures are rounded estimates; international arrivals are a market context indicator, not theme park attendance.
Design Attractions and Experiences for Target Visitor Segments
A profitable theme park begins with a clear picture of who will visit and what they value. Families with young children often need gentle rides, stroller-friendly paths, and quiet indoor spaces. Teenagers may seek faster attractions, social areas, and evening events. Older visitors can appreciate comfortable seating, clear signs, and experiences that do not require long queues. Design for real needs, not broad labels. A shaded bench near a ride can matter as much as the ride itself. Small details count.
Match each experience to its likely cost and revenue. A family attraction might support bundled meals or timed entry, while a special evening show could encourage longer visits. Track wait times, repeat visits, food sales, and visitor feedback by segment. These measures help reveal whether an attraction earns attention and operating costs. Keep it simple. Segments overlap: a parent may want a thrilling ride, too. Treating every visitor as one type is an easy planning mistake. So is building a costly attraction before testing demand. Pilot a smaller version, observe how guests use it, and revise the design—even when the first plan looked convincing.
How to Build a Profitable Theme Park Business Model? - Design Attractions and Experiences for Target Visitor Segments
Illustrative annual planning model. Figures are planning assumptions in USD, not reported results from any specific park or company. Segment shares total 100%; per-visitor contribution is revenue less estimated variable operating costs, before fixed costs, financing, and taxes.
| Target visitor segment | Share of visits | Core visitor need | Attractions and experiences to prioritize | Ticket revenue per visitor | Food, beverage, and retail revenue per visitor | Total revenue per visitor | Estimated variable cost per visitor | Contribution per visitor | Business model focus |
| Families with children | 45% | Shared activities, convenient facilities, and attractions suitable for a range of ages | Family rides, interactive play zones, gentle water attractions, shaded rest areas, and scheduled character-free stage shows | $48 | $32 | $80 | $25 | $55 | Use bundled admission and meal options; encourage longer visits with age-diverse experiences and convenient family services. |
| Teenagers and young adults | 20% | High-energy rides, social experiences, and reasons to return with friends | Thrill rides, competitive attractions, evening events, group photo points, and mobile-friendly queue information | $45 | $28 | $73 | $24 | $49 | Build repeat visitation through seasonal programming, group offers, and a balanced mix of high-capacity and premium experiences. |
| Adult couples and small groups | 15% | A comfortable day out with distinctive food, entertainment, and optional premium experiences | Themed dining, live performances, scenic areas, escape-style attractions, and limited-capacity evening experiences | $52 | $38 | $90 | $29 | $61 | Increase per-guest spending with reservations, upgraded dining, and add-on experiences while maintaining standard admission value. |
| School and youth groups | 12% | Affordable, organized visits with clear learning, safety, and scheduling outcomes | Group-friendly rides, science or nature activities, educational demonstrations, pre-booked meals, and supervised gathering areas | $28 | $15 | $43 | $17 | $26 | Fill weekday capacity with advance-booked group packages and set meal times; manage discounted pricing against lower service costs. |
| Theme park enthusiasts | 8% | New experiences, detailed theming, ride variety, and access to special events | Signature rides, behind-the-scenes tours, seasonal events, collectible merchandise, and timed premium access | $55 | $45 | $100 | $33 | $67 | Offer optional paid upgrades and event access; use new experiences to support repeat visits and off-peak demand. |
| Weighted planning result | 100% | Assumption: 1,000,000 annual visits | — | $77.26 average | $25.08 average | $52.18 average | Approximately $52.18 million in annual contribution before fixed costs at the assumed attendance level. |
Planning note: Validate segment mix, admission pricing, ancillary spending, attendance capacity, seasonality, labor, utilities, maintenance, and fixed-cost assumptions using local market research and operating data before investment decisions.
Plan Operations, Staffing, Safety, and Infrastructure Costs
A profitable theme park starts with an operating plan, not just a list of attractions. Estimate attendance by season, weekday, and peak hour, then connect those figures to ticket revenue, food sales, and maintenance needs. Build separate budgets for utilities, cleaning, ride inspections, insurance, and repairs. These costs continue even on quiet days. A rough forecast will be wrong, so test low-attendance scenarios before committing to major construction.
Staffing and safety shape both the guest experience and the budget. Schedule enough trained operators, first-aid staff, cleaners, and security personnel for busy periods, while avoiding unnecessary shifts during slower hours. Include paid training and staff breaks in labor estimates. Map emergency routes, inspection routines, accessible paths, and clear signage into the site plan. Reliable water, power, drainage, and waste systems also need backup plans. Small details matter. A poorly placed service corridor can slow repairs and disrupt guests.
Tips: Track labor hours, energy use, downtime, and maintenance costs each week. Compare actual results with your forecast, then adjust staffing or opening hours carefully. Keep a repair reserve; delaying a small fix can become expensive. Revisit assumptions often, because some will miss the mark.
Forecast Cash Flow and Measure Long-Term Profitability
A profitable theme park model starts with cash timing, not annual ticket revenue. A family may buy tickets months ahead, while payroll, food, utilities, and maintenance costs arrive on different schedules. Forecast monthly cash flow across peak days, school breaks, and quiet winter weeks. Tickets are only one stream. Food, parking, events, and merchandise can lift guest spending, but each also brings staffing and inventory costs.
The 2023 TEA/AECOM Theme Index reported that attendance at the world’s top 25 theme parks rose 23.1% from 2022. That shows recovery among leading parks, not a guarantee for every new project.
Use local demand data, then test attendance falling 10% below plan and construction costs rising. Keep debt payments, seasonal hiring, and major ride inspections visible in separate lines. A spreadsheet can look convincing. It can still be wrong.
One useful measure is free cash flow after routine maintenance and scheduled capital spending, not just operating profit. A ride may attract guests for years, yet require a costly refurbishment midway through its useful life.
Set aside a replacement reserve each month and compare projected returns across several years. I would challenge optimistic forecasts most when they assume every busy weekend sells out. That assumption is easy to type and difficult to defend.